3Y
...
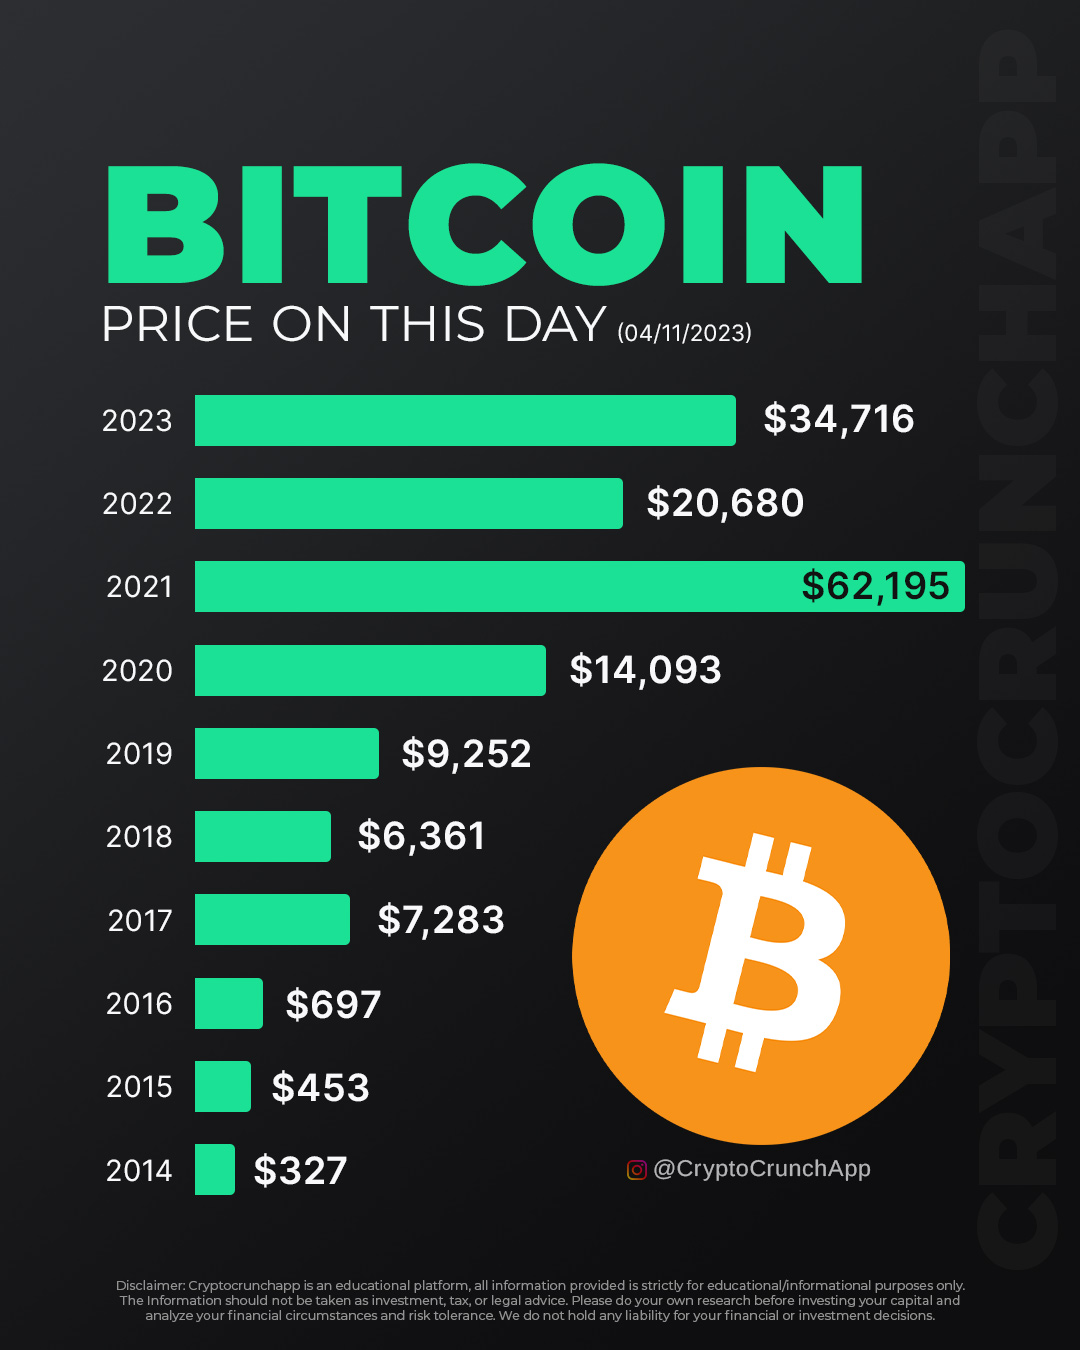
- 2023: $34,716
- 2022: $20,680
- 2021: $62,195
- 2020: $14,093
- 2019: $9,252
- 2018: $6,361
- 2017: $7,283
- 2016: $697
- 2015: $453
- 2014: $327
Analyzing Bitcoin’s price on the 4th of November from 2014 to 2023 provides a data-driven narrative of its performance. Starting at $327 in 2014 and reaching $34,716 in 2023, the journey has been marked by significant milestones. The data shows an early phase of gradual growth, a pattern disrupted by explosive surges and sharp corrections.
The steep incline to $7,283 in 2017, followed by a drop to $6,361 in 2018, could be interpreted as a market correction after speculative trading. Notably, from 2019 onwards, a general upward trend resumes, with year-on-year growth except for 2022. This dip to $20,680, before a recovery in 2023, suggests Bitcoin’s sensitivity to macroeconomic factors, likely intensified by global financial uncertainties.
The November 4th price points are pivotal markers in Bitcoin’s timeline, each year offering a glimpse into investor sentiment and market stability. This date-specific trend analysis reveals resilience in the face of volatility, with an overall upward trajectory over the decade, despite short-term fluctuations.
Investors might consider these historical November 4th prices as part of a broader research strategy, alongside technical analysis and market trends, to forecast future movements. While historical data cannot predict future outcomes, it can provide a foundation for understanding Bitcoin’s market behavior and potential response to future events.