3Y
...
...
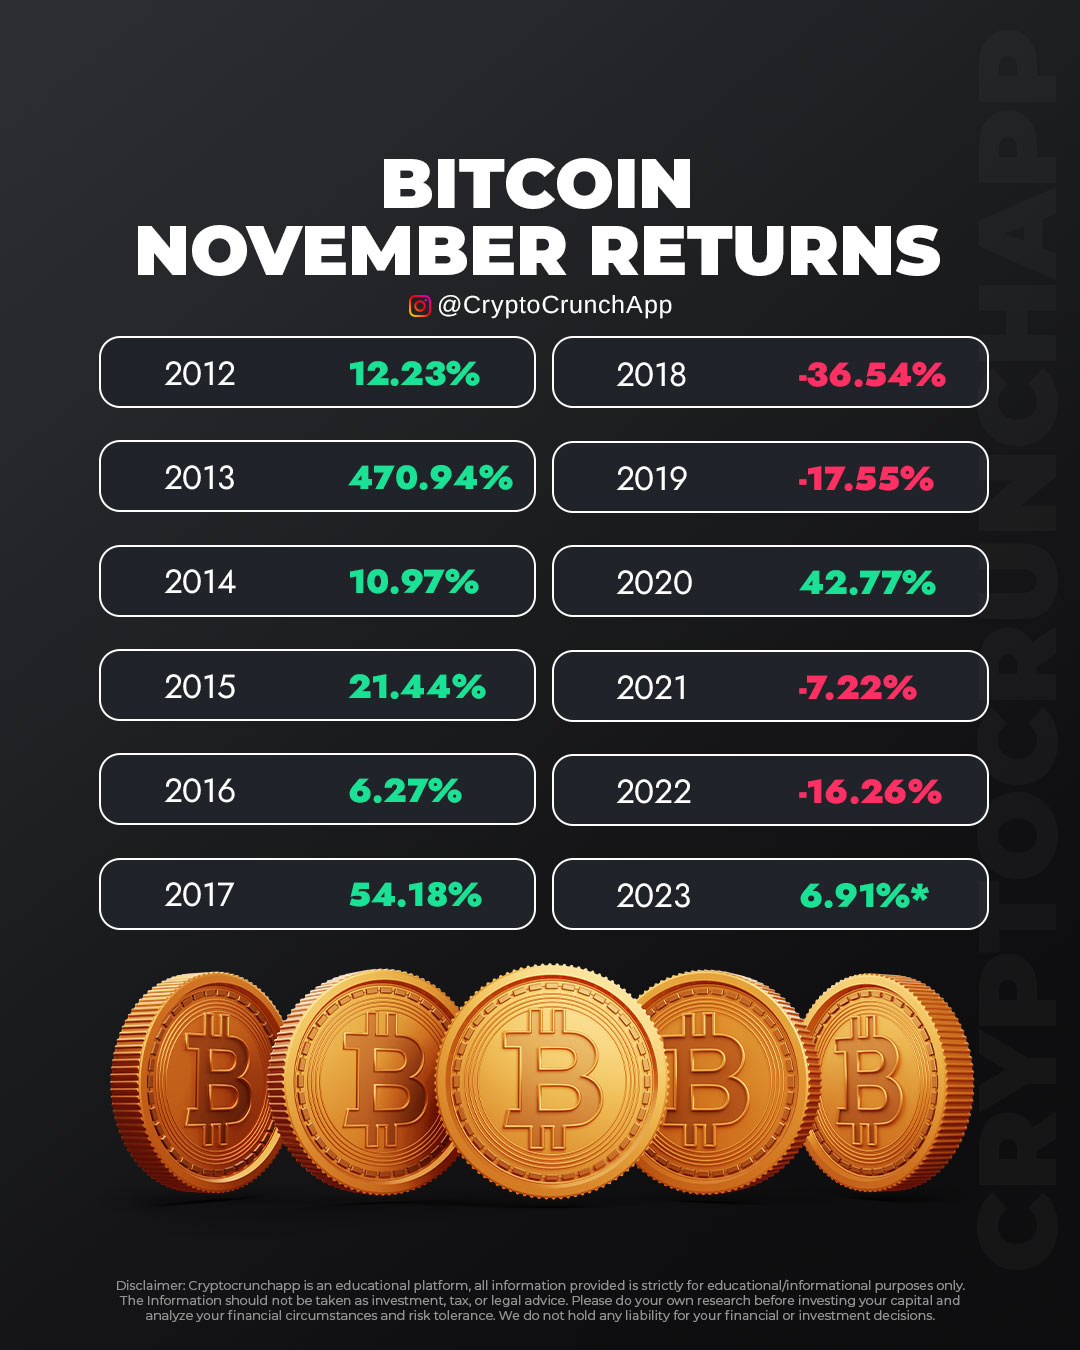
Bitcoin has written a unique November story each year, creating a patchwork of profit and loss that intrigues investors and analysts alike. The high of 2013 and the slump of 2018 are standout chapters in this ongoing saga.
Below is the annual data that highlights the dynamic nature of Bitcoin’s November performance
- 2012: +12.23%
- 2013: +470.94%
- 2014: +10.97%
- 2015: +21.44%
- 2016: +6.27%
- 2017: +54.18%
- 2018: -36.54%
- 2019: -17.55%
- 2020: +42.77%
- 2021: -7.22%
- 2022: -16.26%
- 2023: +6.91%*
*Note: The 2023 data may be subject to final adjustments.
45.7K Reads