


3Y
...
...
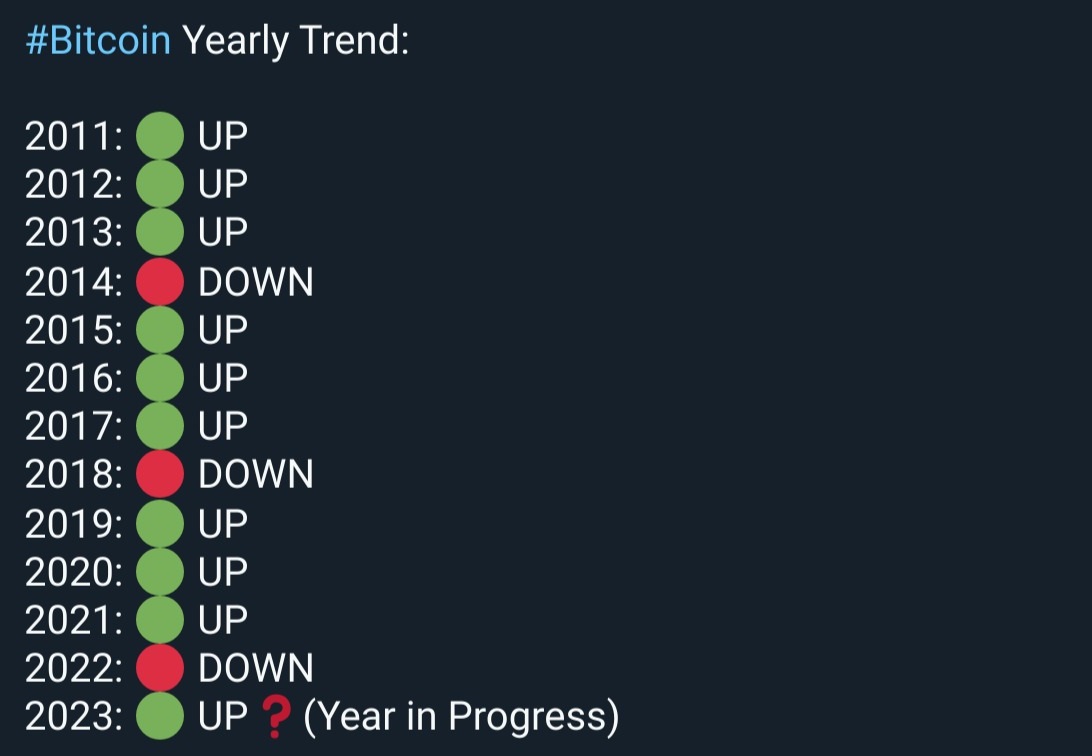
- 2011: ↑ UP
- 2012: ↑ UP
- 2013: ↑ UP
- 2014: ↓ DOWN
- 2015: ↑ UP
- 2016: ↑ UP
- 2017: ↑ UP
- 2018: ↓ DOWN
- 2019: ↑ UP
- 2020: ↑ UP
- 2021: ↑ UP
- 2022: ↓ DOWN
- 2023: ↔️ UP* (Year in Progress)
Historical data since 2011 shows Bitcoin following an intriguing pattern: after enjoying three consecutive years of upward trends, it takes a breather with a downturn, as seen in 2014 and 2018. The year 2022, marking another decline, perpetuates this three-year cycle theory. If this pattern holds true, 2023-2025 could be bullish, but only time will confirm this speculation.
33.5K Reads

