2Y
...
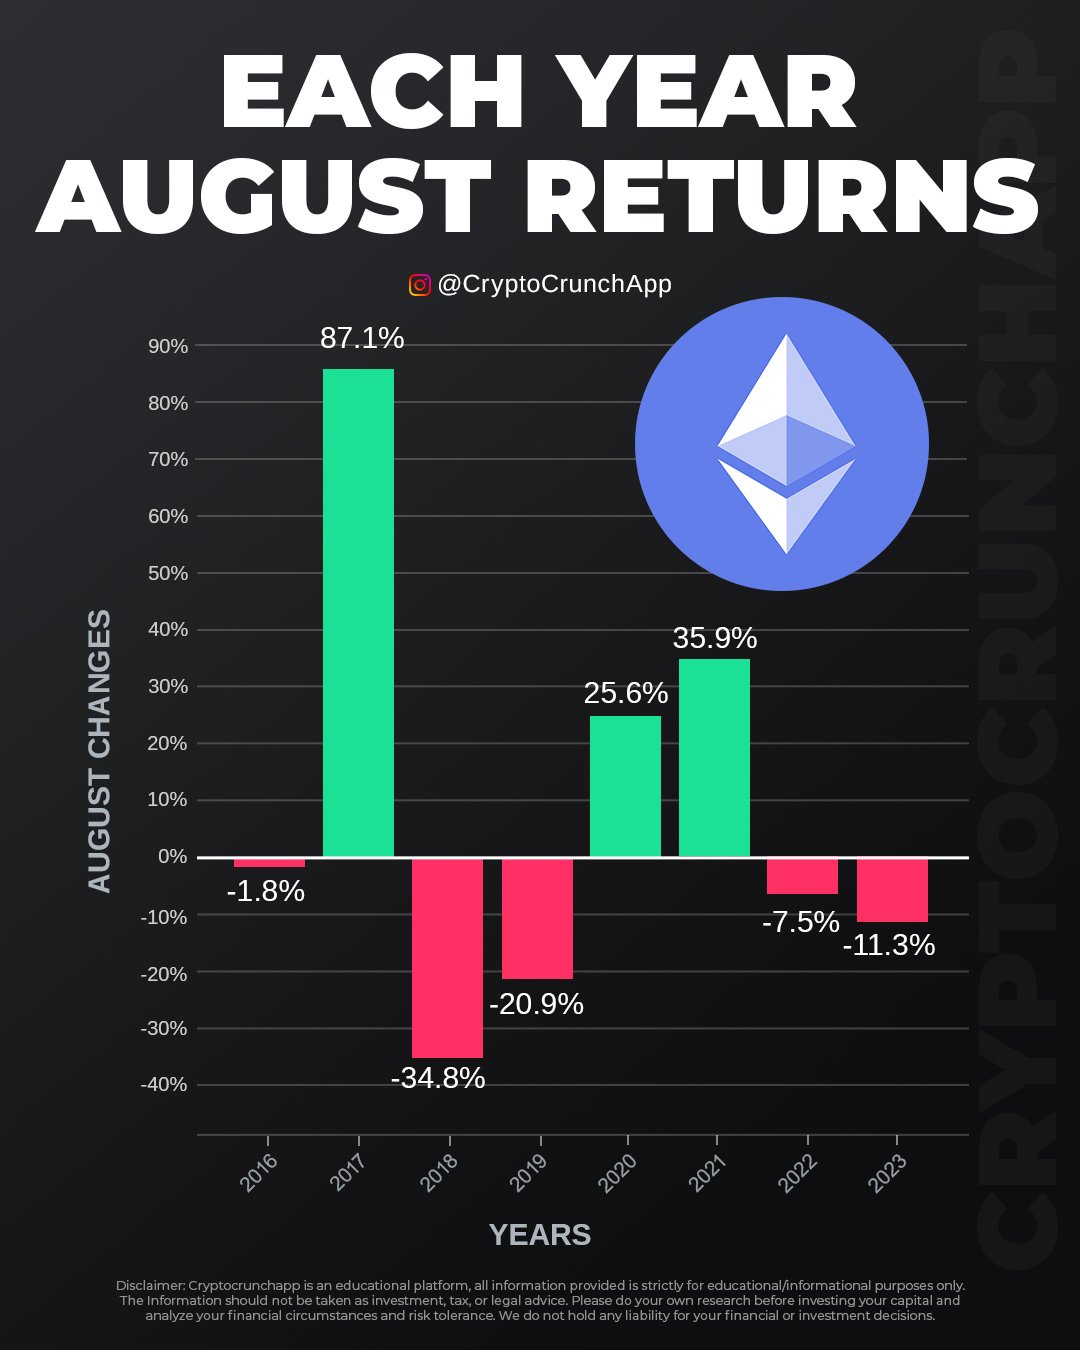
Ethereum’s performance in August has illustrated the highly volatile nature of the cryptocurrency market over the years. In 2016, Ethereum experienced a modest downturn with a -1.8% return. This trend drastically shifted in 2017 when the market saw an impressive surge, recording an 87.1% increase, showcasing the potential for significant gains in the crypto space.
However, the market’s volatility became evident again in 2018 with a steep decline of -34.8%, the worst recorded for the month. This was followed by a -20.9% return in 2019, further emphasizing the unpredictable fluctuations. A positive turn occurred in 2020, with Ethereum recovering and gaining 25.6%, reflecting a renewed investor confidence and market stabilization.
The upward trend continued into 2021 with a 35.9% increase, though slightly tapered off, remaining positive. However, 2022 saw a return dip to -7.5%, indicating another challenging month. The trend of difficulties persisted in 2023 with a -11.3% decrease in value. These annual fluctuations underscore Ethereum’s volatile nature, mirroring broader economic trends, investor sentiment, and specific market dynamics of each year.
Disclaimer: Market capitalizations and data can vary in real-time. The information provided here is intended purely for educational purposes and should not, under any circumstances, be construed as financial advice.
Join CryptoCrunchApp on Telegram Channels – Click to Join