2Y
...
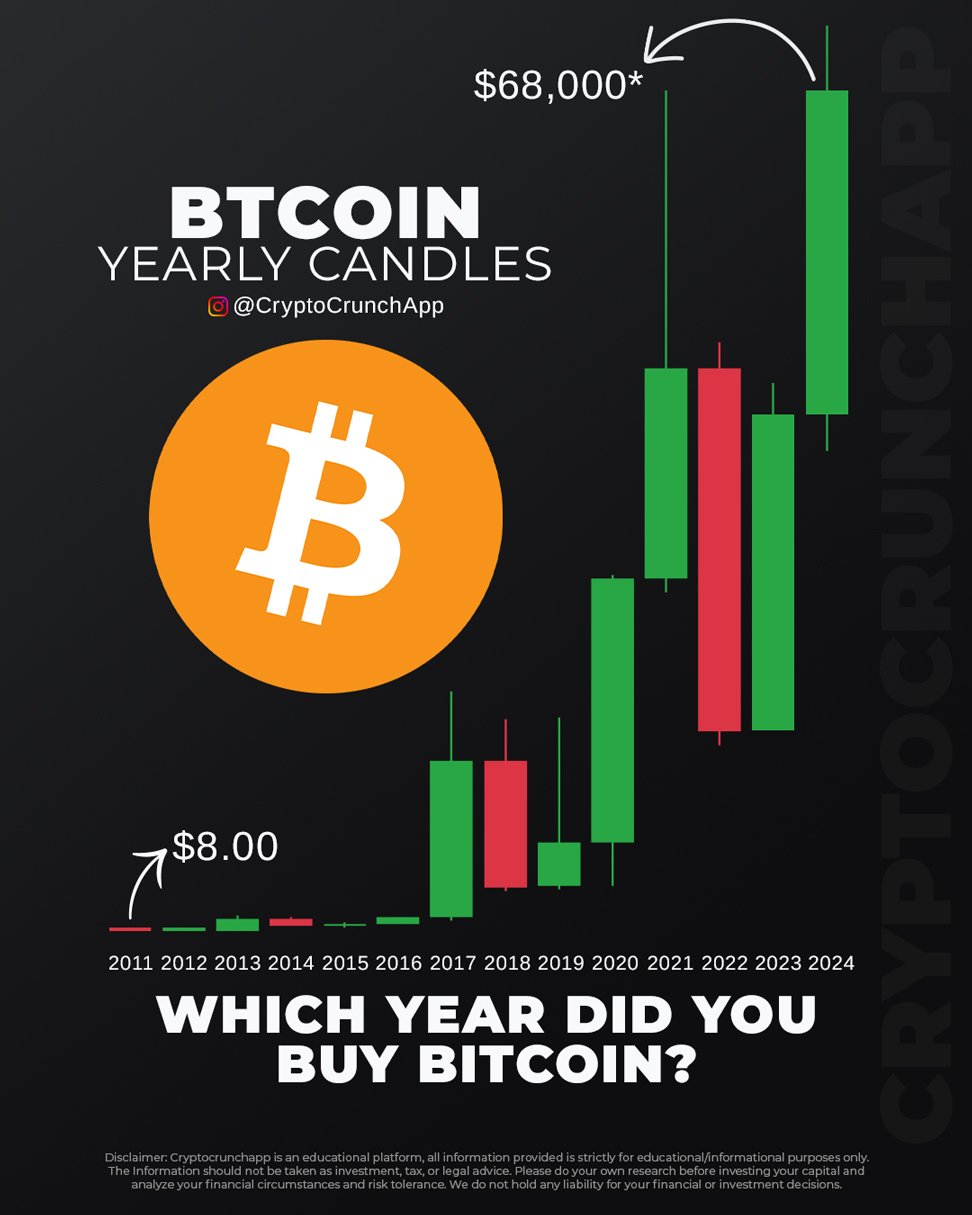
Bitcoin’s journey over the years is nothing short of remarkable, as illustrated by its yearly candles chart. The graphic shows Bitcoin’s price evolution from its humble beginnings, where it was valued at just $8 in 2011, to its impressive peak of $68,000 in recent years.
This visual representation highlights Bitcoin’s volatile yet upward trajectory, marking significant milestones along the way. Early adopters who bought Bitcoin in its initial years have seen substantial returns on their investment. The chart reflects periods of rapid growth, as well as corrections, which are natural in the volatile cryptocurrency market.
Whether you’re an early adopter or a more recent investor, the chart serves as a testament to Bitcoin’s enduring appeal and potential as a revolutionary digital asset.
Disclaimer: Market capitalizations and data can vary in real-time. The information provided here is intended purely for educational purposes and should not, under any circumstances, be construed as financial advice.
Join CryptoCrunchApp on Telegram Channels – Click to Join