2Y
...
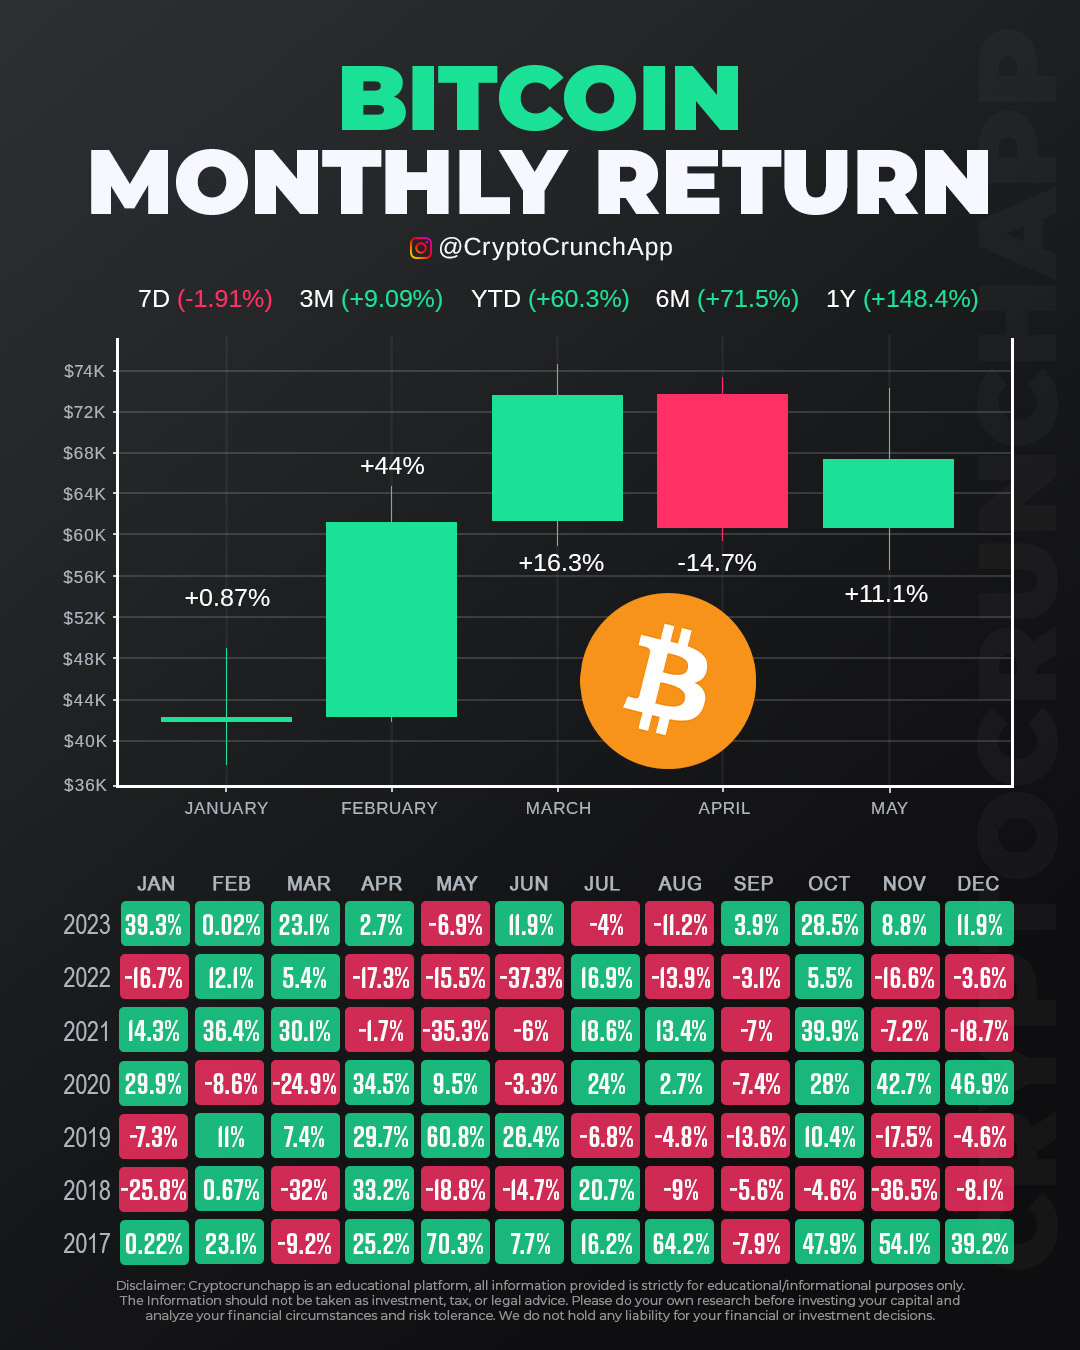
Bitcoin’s monthly return chart offers a comprehensive look at its performance over various timeframes. The chart shows Bitcoin’s performance for the past 7 days (-1.91%), 3 months (+9.09%), year-to-date (+60.3%), 6 months (+71.5%), and 1 year (+148.4%).
January saw a modest increase of +0.87%, followed by a significant surge of +44% in February. March maintained a positive trend with a +16.3% return, but April experienced a dip of -14.7%. May closed with an 11.1% gain, showcasing Bitcoin’s volatility and potential for recovery.
The detailed monthly returns table highlights the performance of Bitcoin across different months and years, providing a historical perspective. The variations in returns reflect Bitcoin’s fluctuating market conditions, influenced by a myriad of factors including market sentiment, regulatory news, and macroeconomic trends.
Investors and enthusiasts can use this data to understand the cyclical nature of Bitcoin’s price movements and to strategize their investments accordingly. As always, staying informed and analyzing past performance can offer valuable insights into future trends.
Disclaimer: Market capitalizations and data can vary in real-time. The information provided here is intended purely for educational purposes and should not, under any circumstances, be construed as financial advice.
Join CryptoCrunchApp on Telegram Channels – Click to Join